Dashboard
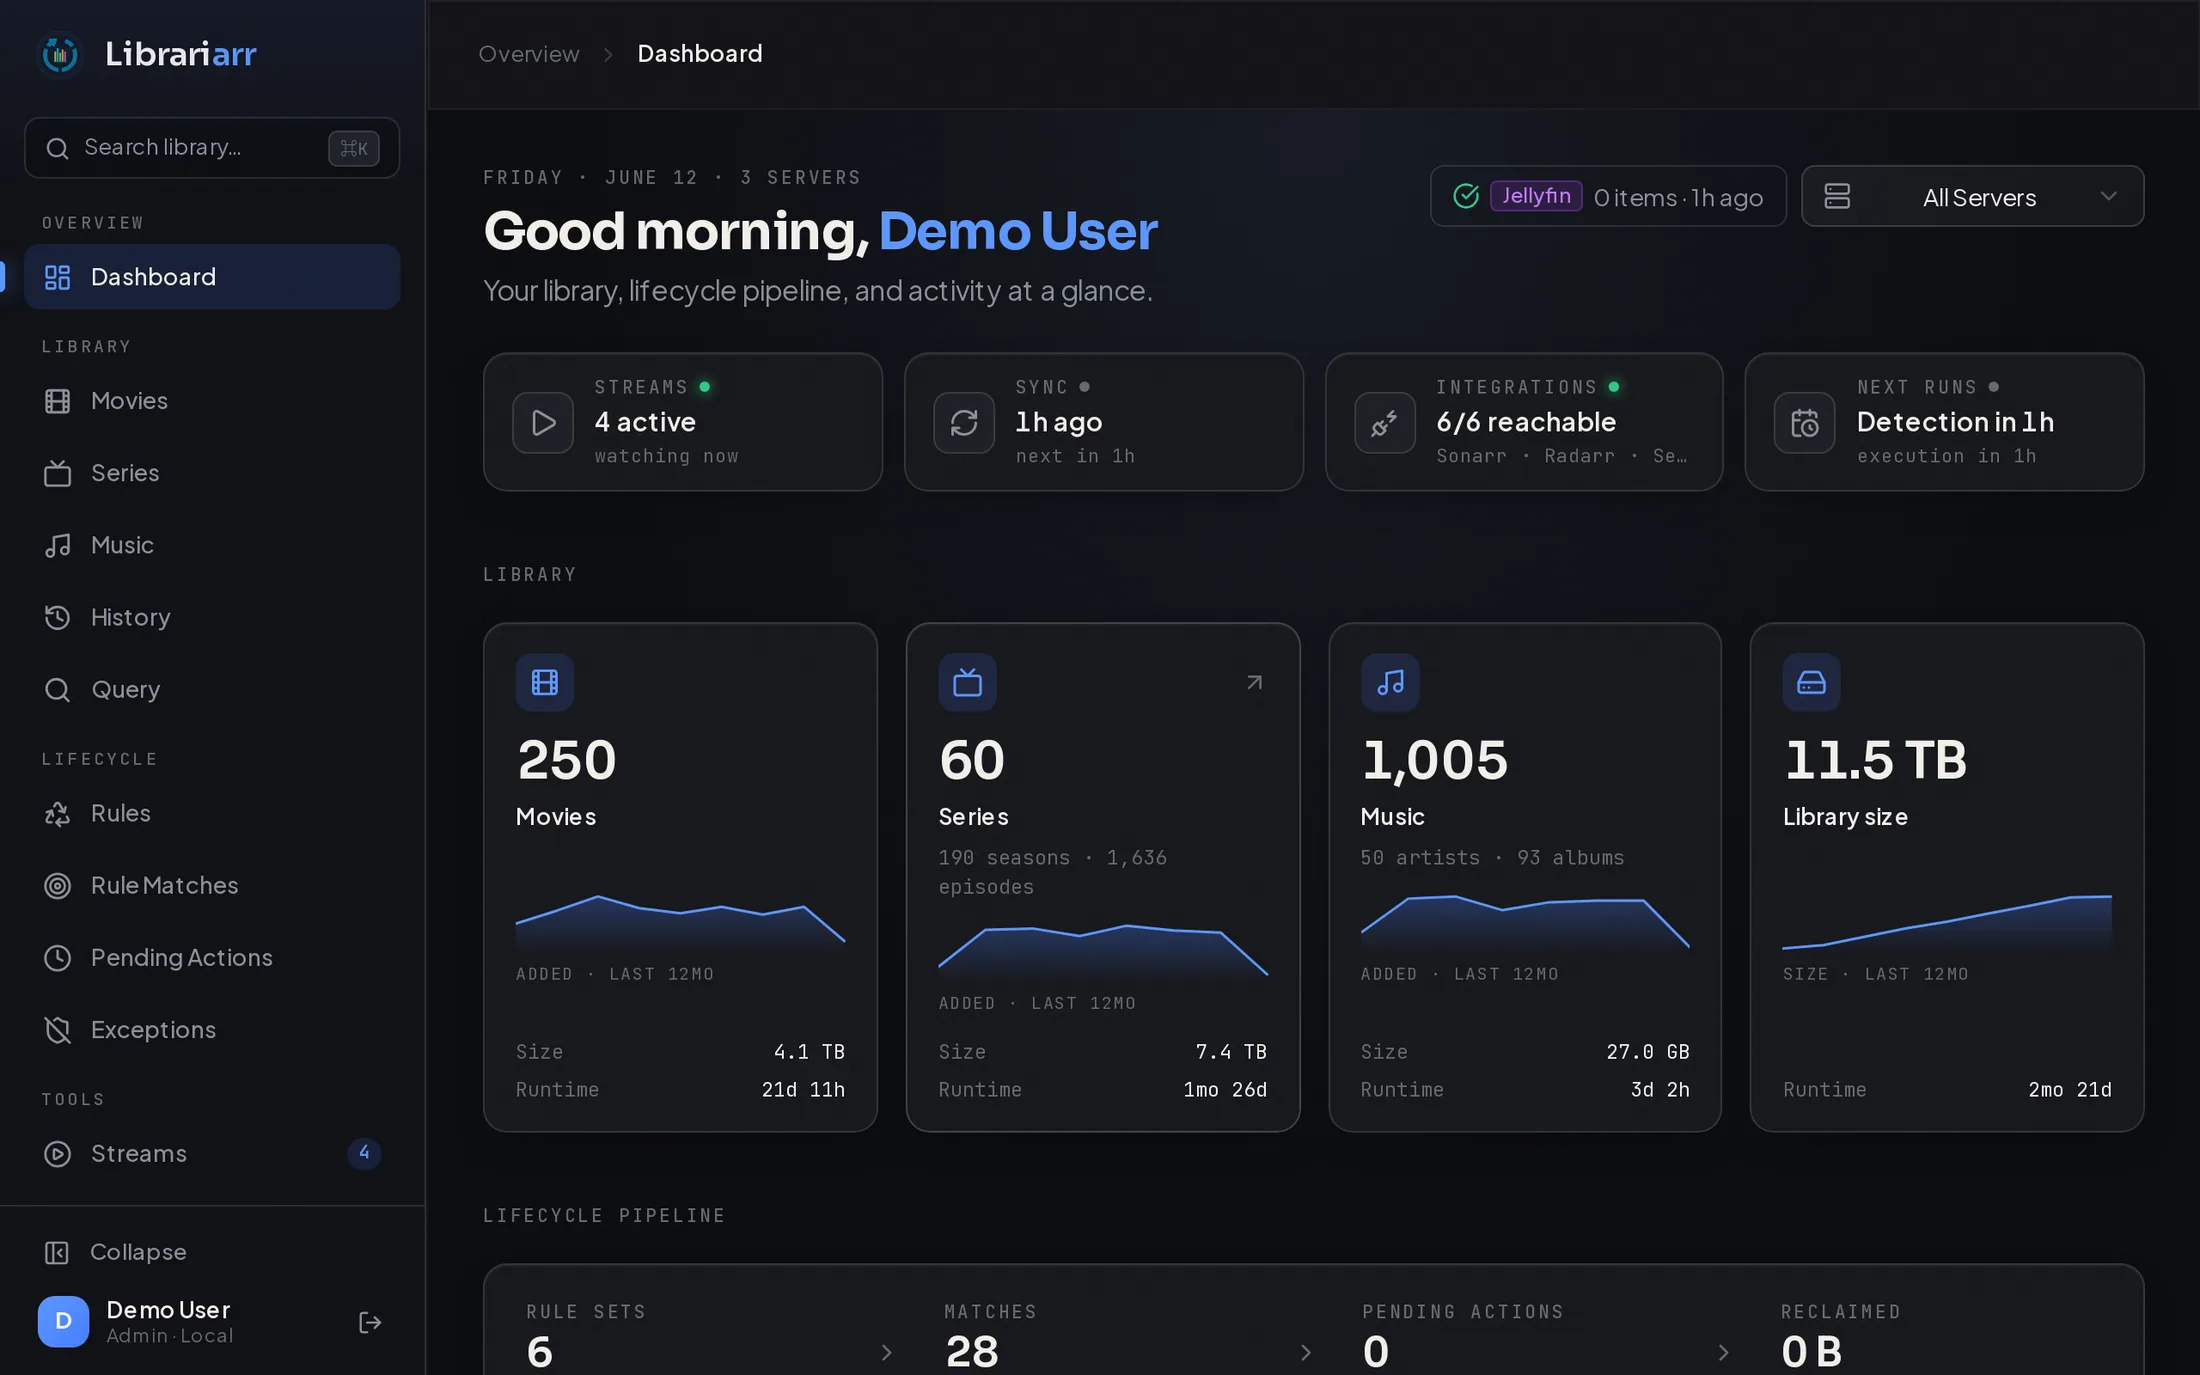
The dashboard is the landing page after login — an operations console for your media libraries, organized into purpose-built zones from "what's happening right now" down to deep-dive charts.
Status Strip
Section titled “Status Strip”A compact row of live operational tiles at the top of the page. Each tile links to the page where you can act on it:
| Tile | Shows | Links to |
|---|---|---|
| Streams | Active playback session count; warns when a media server is unreachable | Tools → Streams |
| Sync | Whether a sync is running, when the last one finished, and the next scheduled sync | Settings → Scheduling |
| Integrations | How many Sonarr/Radarr/Lidarr/Seerr instances are reachable, naming any that are down | Settings → Integrations |
| Next runs | Countdown to the next lifecycle detection and execution runs | Settings → Scheduling |
| Update | Appears only when a newer Librariarr version is available | Settings → System |
Slow data sources (streams and integration health probe your servers) load in the background without blocking the rest of the page.
Library Overview
Section titled “Library Overview”One tile per media type — Movies, Series, Music — plus a Library Size total. Each type tile shows the item count, a 12-month additions sparkline (hover it to see the exact count for each month), and size/runtime details, and clicks through to that library's browse page. The Library Size tile charts total size over the same window instead — hovering shows what your library size was at each month.
Lifecycle Pipeline
Section titled “Lifecycle Pipeline”The lifecycle system as a funnel, each stage linking to its page:
Rule sets (enabled count) → Matches (items currently matched) → Pending actions (scheduled work, with the next execution countdown) → Reclaimed (space freed by completed deletions).
If you haven't created any rule sets yet, this zone shows a shortcut to create your first one.
Recently Added
Section titled “Recently Added”A horizontally scrollable poster shelf of the newest additions across your libraries — 2:3 posters for movies and episodes (episodes show the series poster), square album art for music — each with an added-time badge, hover details, and type/server filters.
Insights
Section titled “Insights”A fully customizable chart grid — this is the only zone with a layout editor. Click Customize to rearrange, resize, remove, or add cards. Your layout is saved automatically and persists across sessions.
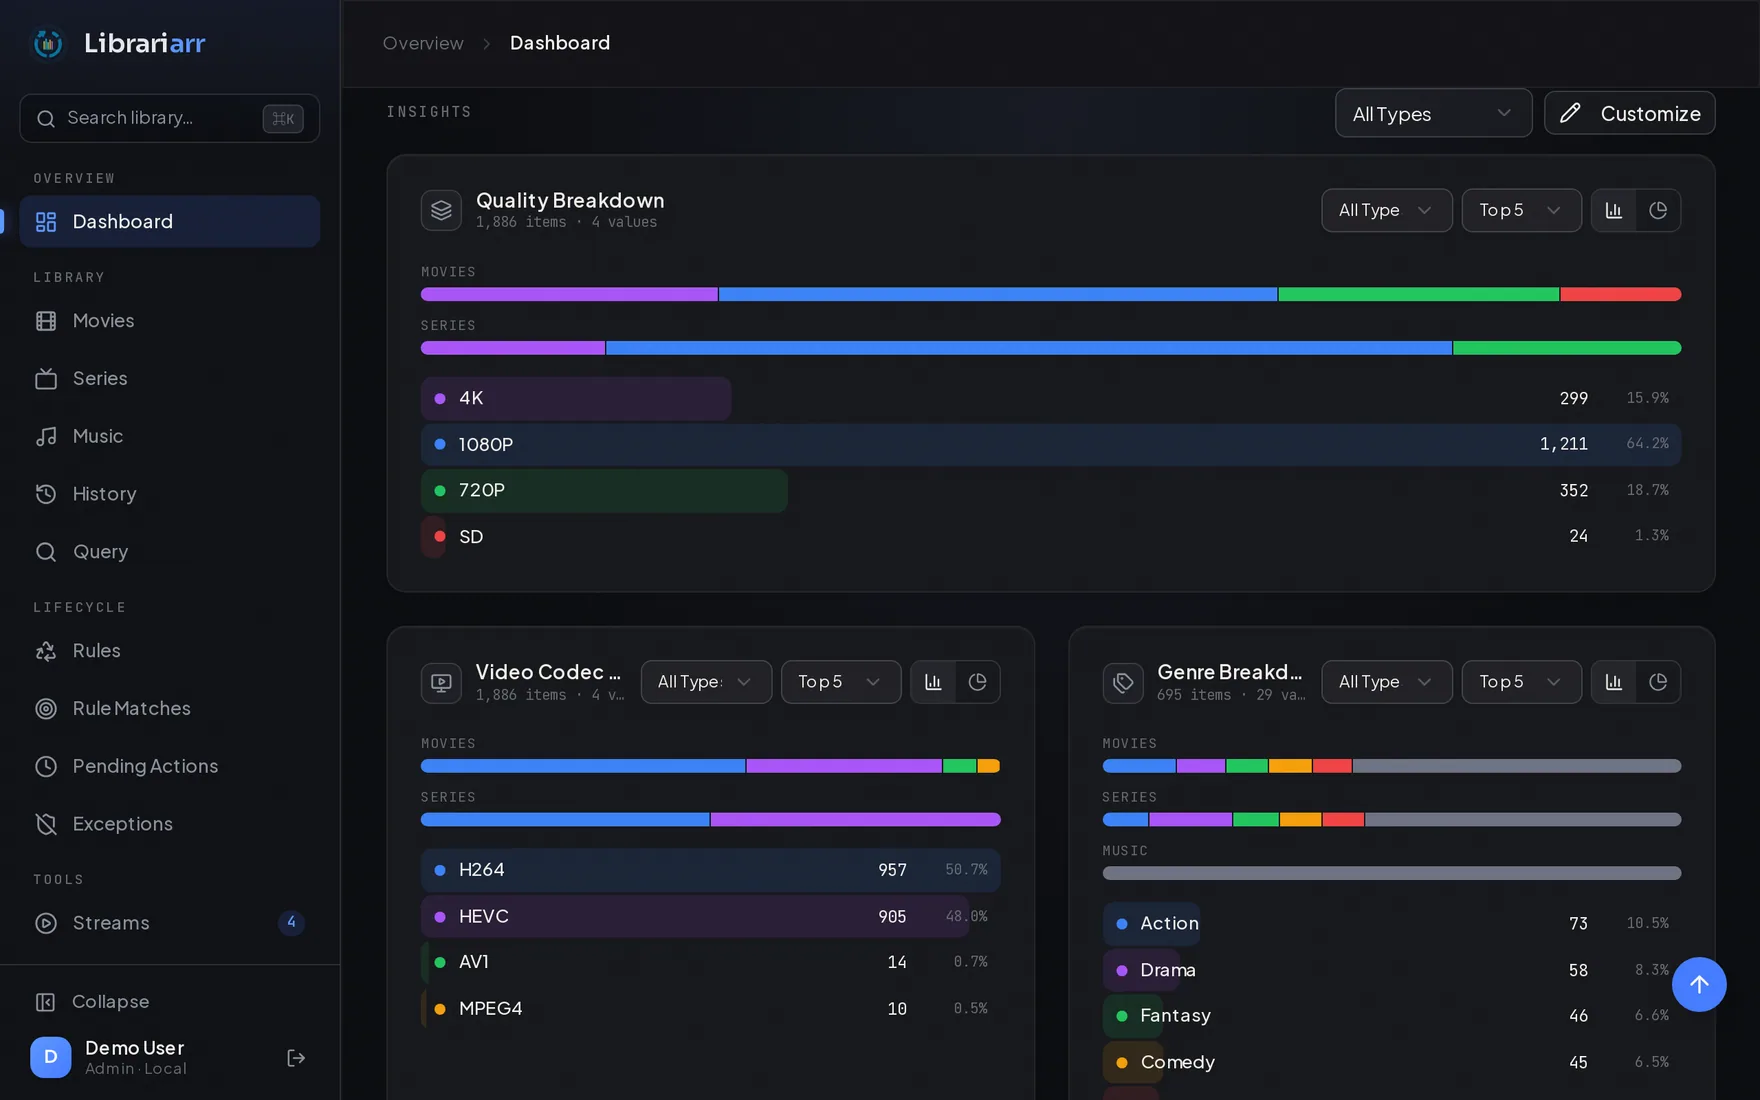
Distribution cards share one design: per-type proportion strips (or a donut with the total in its center) above ranked value rows whose background fill shows each value's share. Click a row to exclude that value from the totals; hover a row for its per-type split. Top Played cards show artwork thumbnails for each entry.
Built-in Cards
Section titled “Built-in Cards”| Card | Description |
|---|---|
| Quality Breakdown | Resolution distribution across your library |
| Video Codec | Video codec distribution (H.264, HEVC, etc.) |
| Audio Codec | Audio codec distribution (AAC, AC3, etc.) |
| Content Rating | Content rating distribution (PG, R, TV-MA, etc.) |
| Top Played | Most played movies, series, and music |
| Dynamic Range | HDR format distribution (Dolby Vision, HDR10, SDR, etc.) |
| Audio Channels | Surround sound layout distribution (Stereo, 5.1, 7.1, etc.) |
| Genre Breakdown | Genre distribution across your library |
| Seerr Requests | Top requesters and watch follow-through |
The media type filter above the grid scopes every chart to Movies, Series, or Music.
Custom Cards
Section titled “Custom Cards”Custom cards let you create charts with any dimension and chart type. Click Customize → Add Card → Custom Card.
Chart Types
Section titled “Chart Types”| Type | Description |
|---|---|
| Bar | Vertical bar chart |
| Pie | Donut chart |
| Line | Line chart |
| Area | Filled area chart |
| Radar | Spider/radar chart |
| Treemap | Proportional rectangle grid |
| Heatmap | Two-dimension correlation grid (requires two dimensions) |
| Count | Large single number |
| Timeline | Time-series chart with zoom slider; pick a date field for the X-axis, an optional breakdown dimension for colored series, and a time interval (day, week, month, quarter, year) |
Available Dimensions
Section titled “Available Dimensions”Custom cards can visualize data across many dimensions, grouped by category:
- Video — Resolution, Video Codec, Dynamic Range, Video Profile, Frame Rate, Bit Depth, Scan Type, Aspect Ratio, Video Bitrate
- Audio — Audio Codec, Audio Channels, Audio Profile, Sampling Rate, Audio Bitrate
- Streams — Audio Language, Subtitle Language
- Content — Content Rating, Genre, Year, Studio, Countries
- File — Container, File Size, Duration
- Dates — Added Date, Last Played, Release Date
- Engagement — Critic Rating, Audience Rating, Play Count
Server Filter
Section titled “Server Filter”When multiple servers are connected, the server selector in the page header scopes the library tiles, sparklines, recently added, and insight charts to a single server.
Multi-Server Statistics
Section titled “Multi-Server Statistics”When multiple servers are connected, the Deduplicate stats across servers setting in Settings → General controls how items are counted:
- On: Media that exists on multiple servers is counted once
- Off: Every copy on every server is counted separately